Dashboard
This section Shows you the layout and what each area is and does.
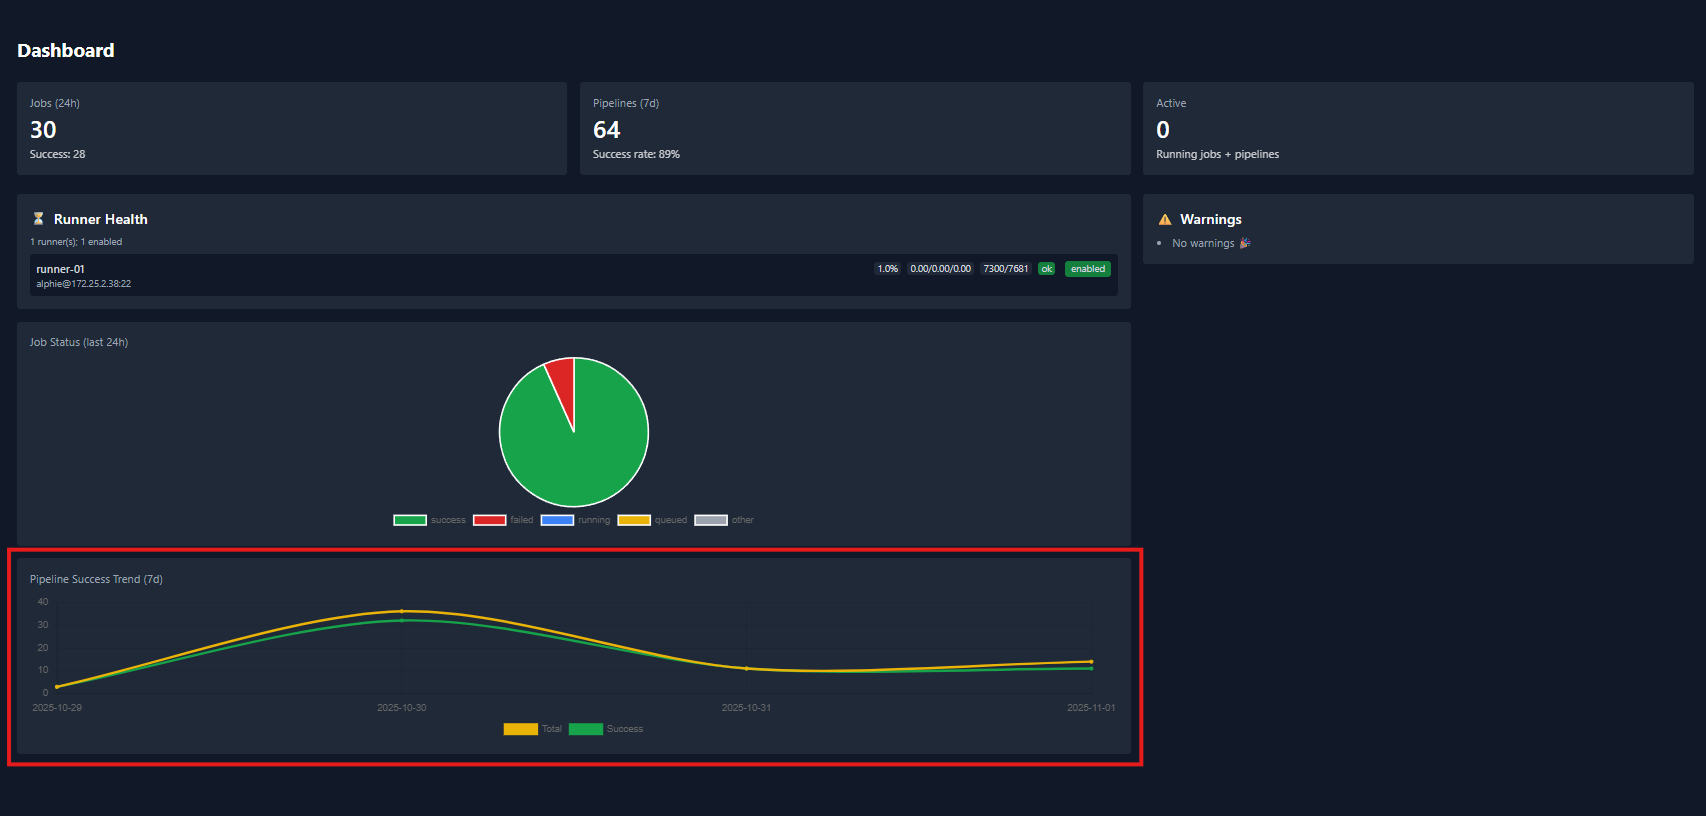
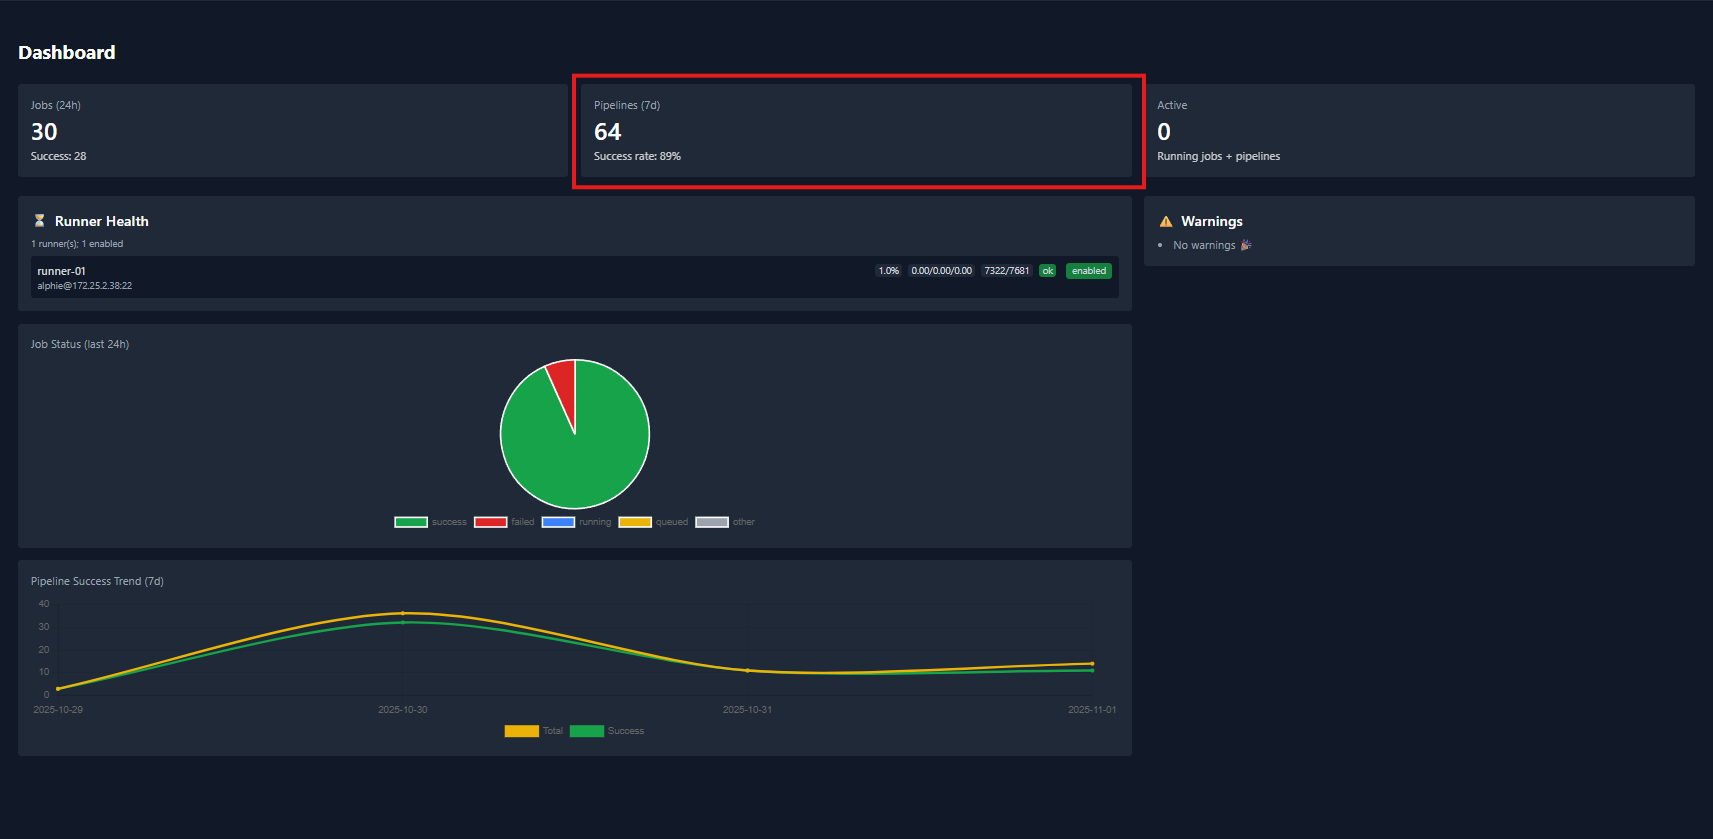
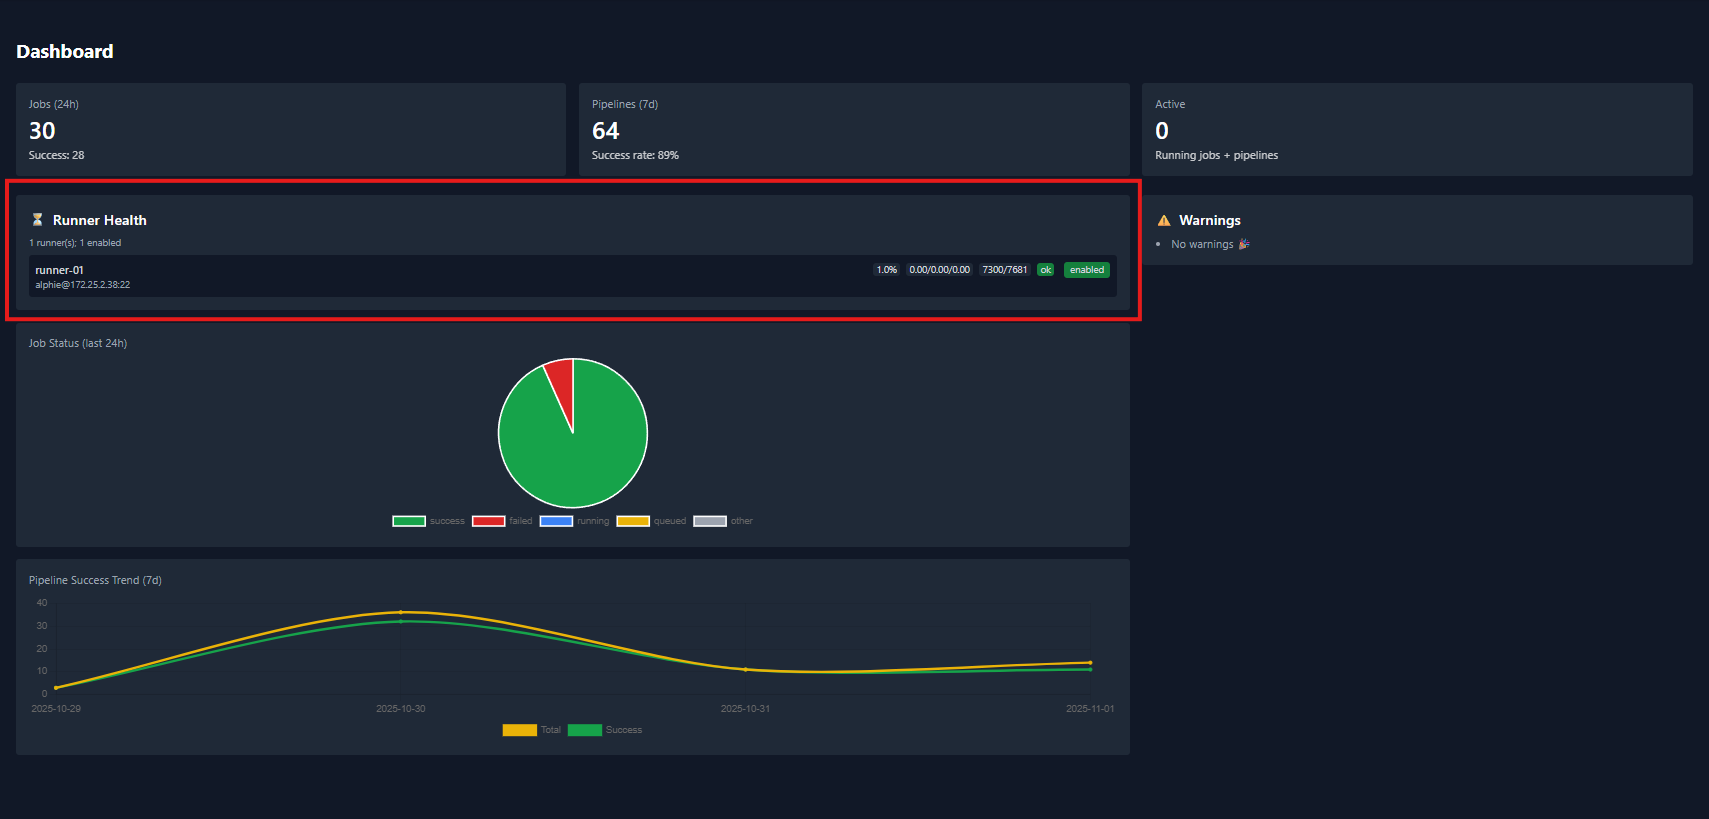
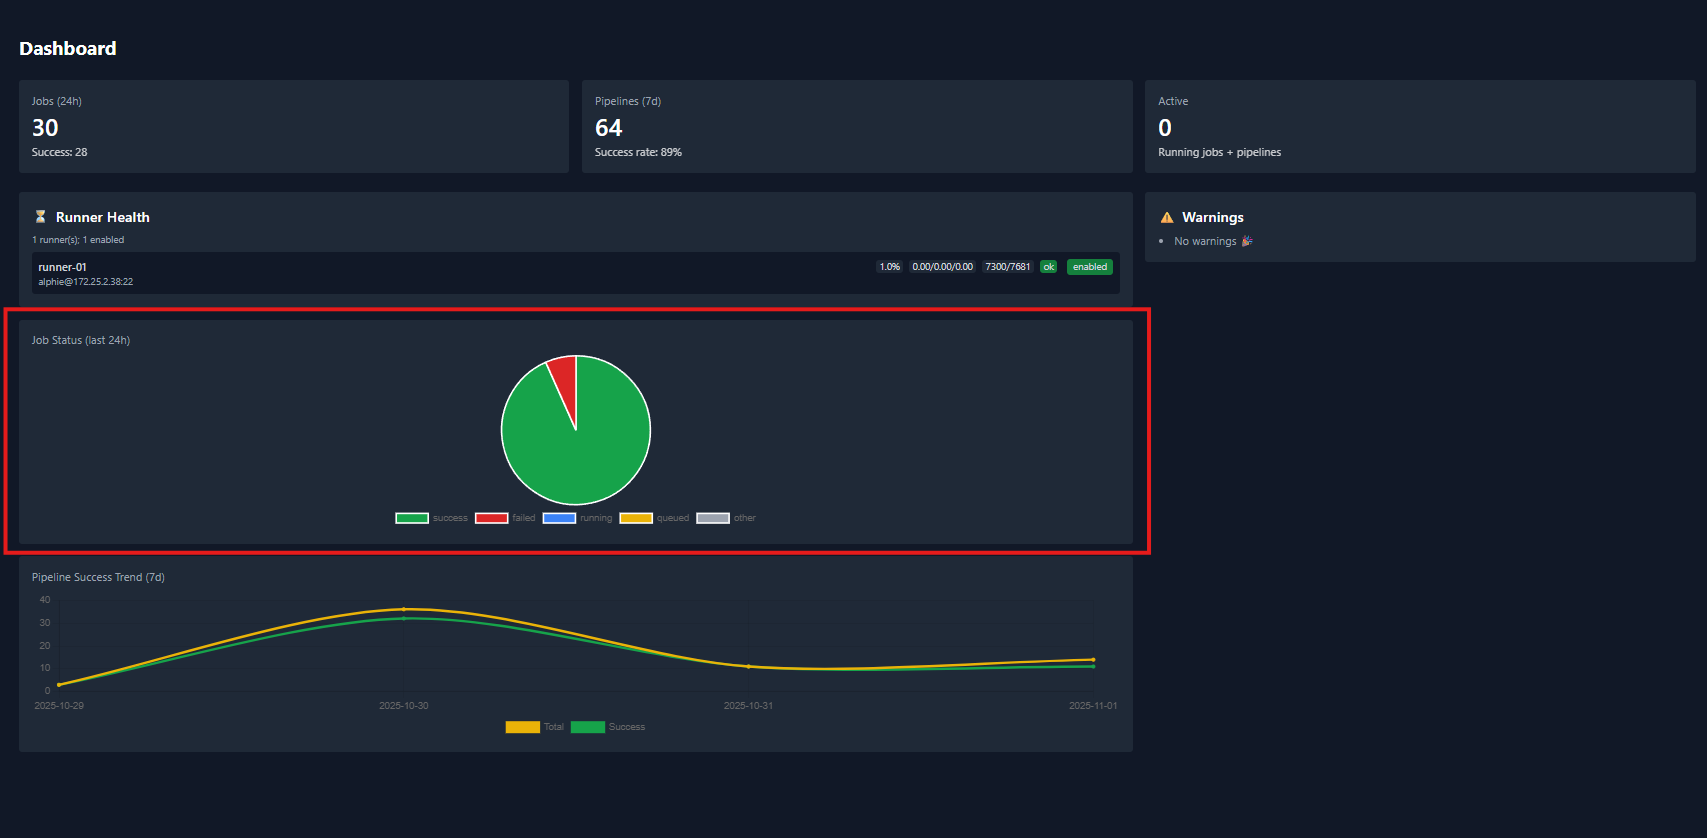
Main Dashboard
When you first login, this is what the main dashboard will look like. After runbooks and pipelines have ran.
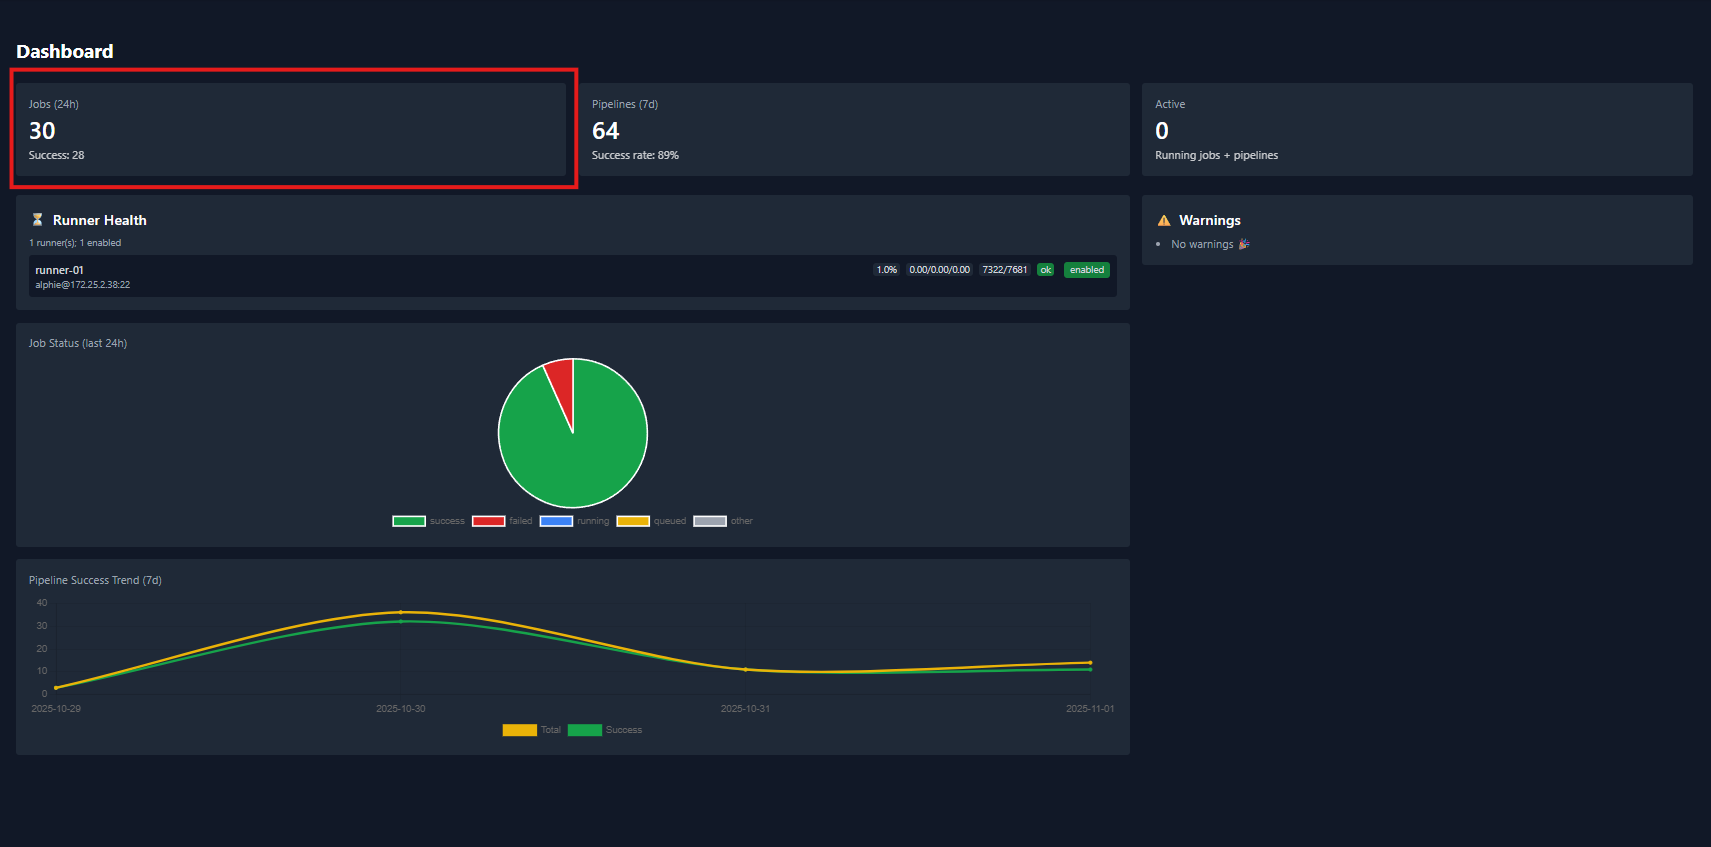
Jobs (24h)
Shows how many runbooks have run—and how many succeeded—in the last 24 hours.
Pipelines (7d)
7-day pipeline summary: total runs and success rate.
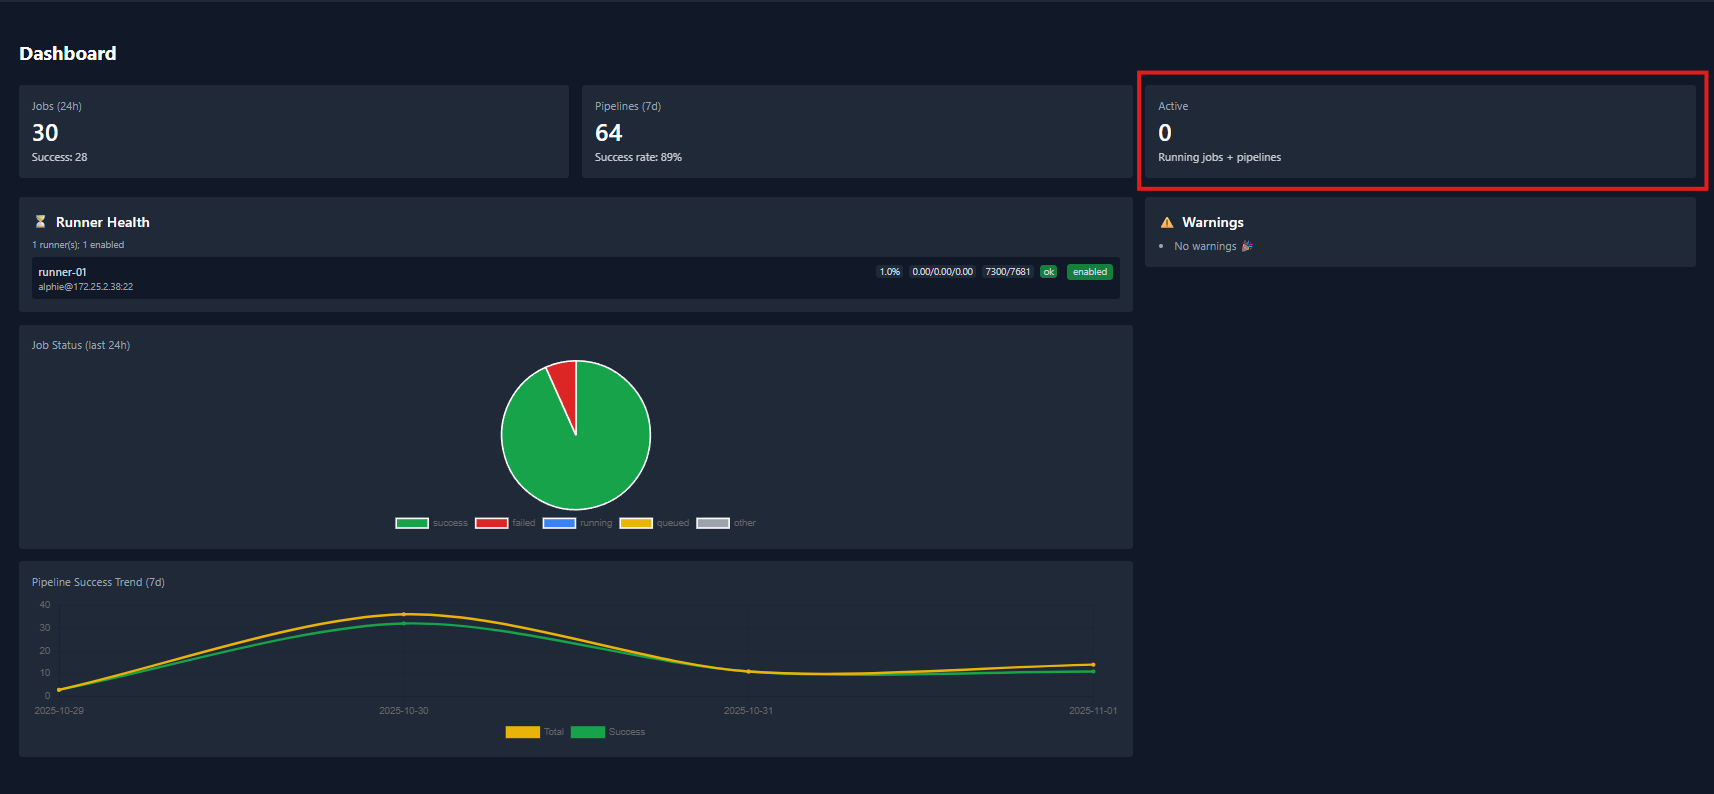
Active Runs
Displays the number of runbooks and pipelines currently running.
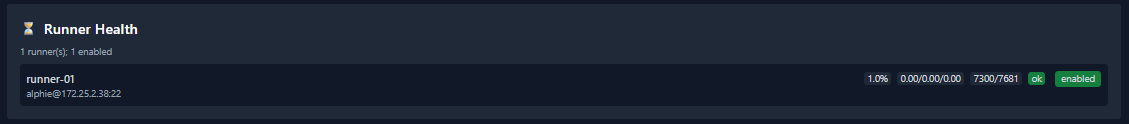
Runners
Shows the current runners attached to the controller and their status.
Warnings
Alerts you when a runbook or pipeline fails repeatedly (consecutive failures).
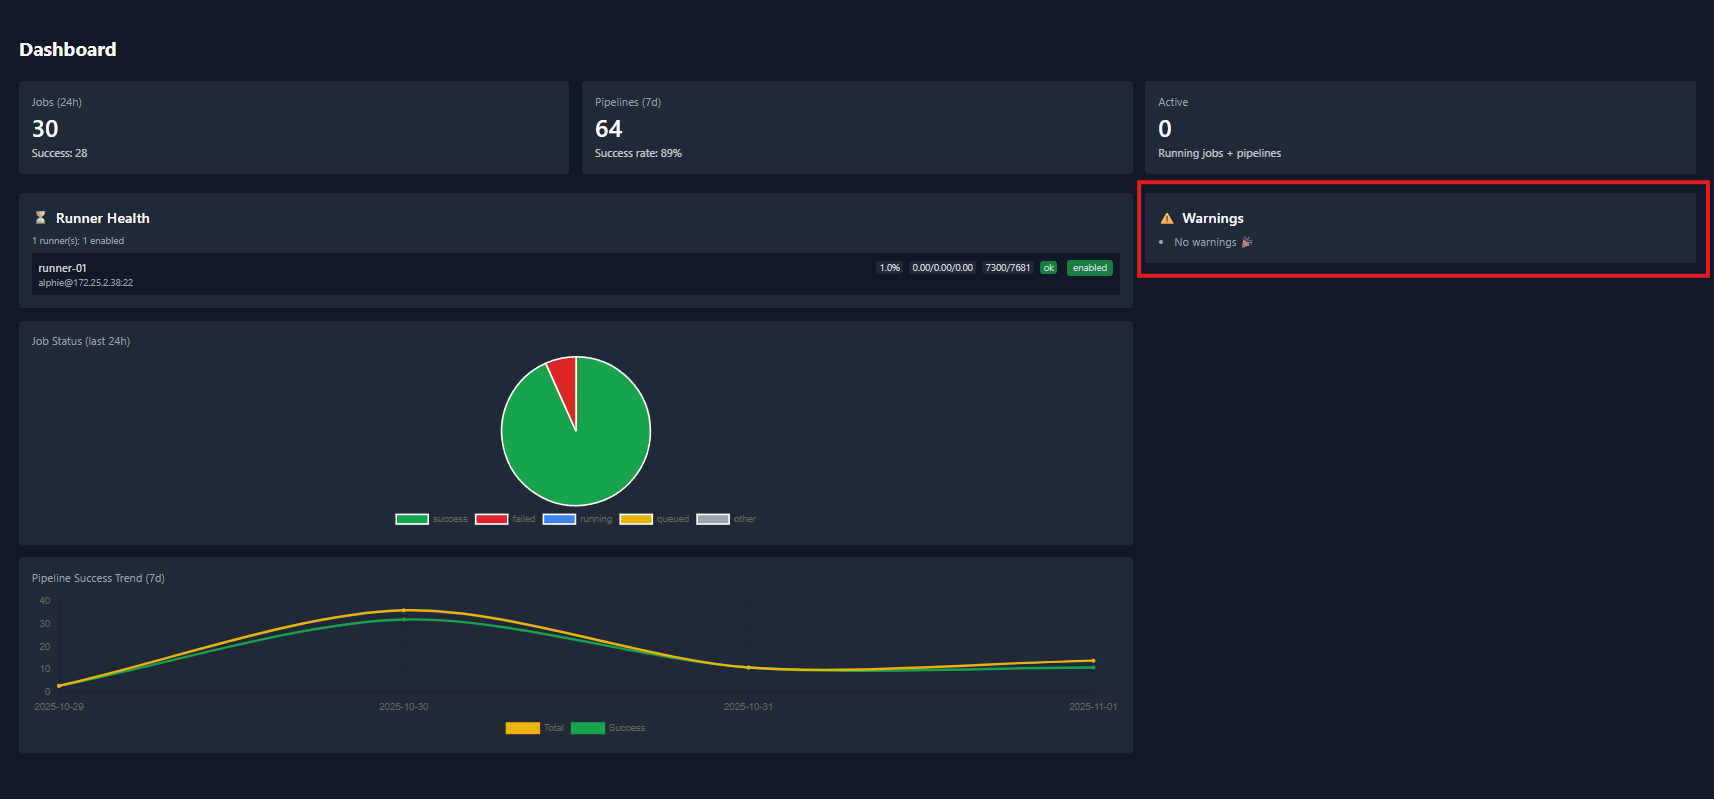
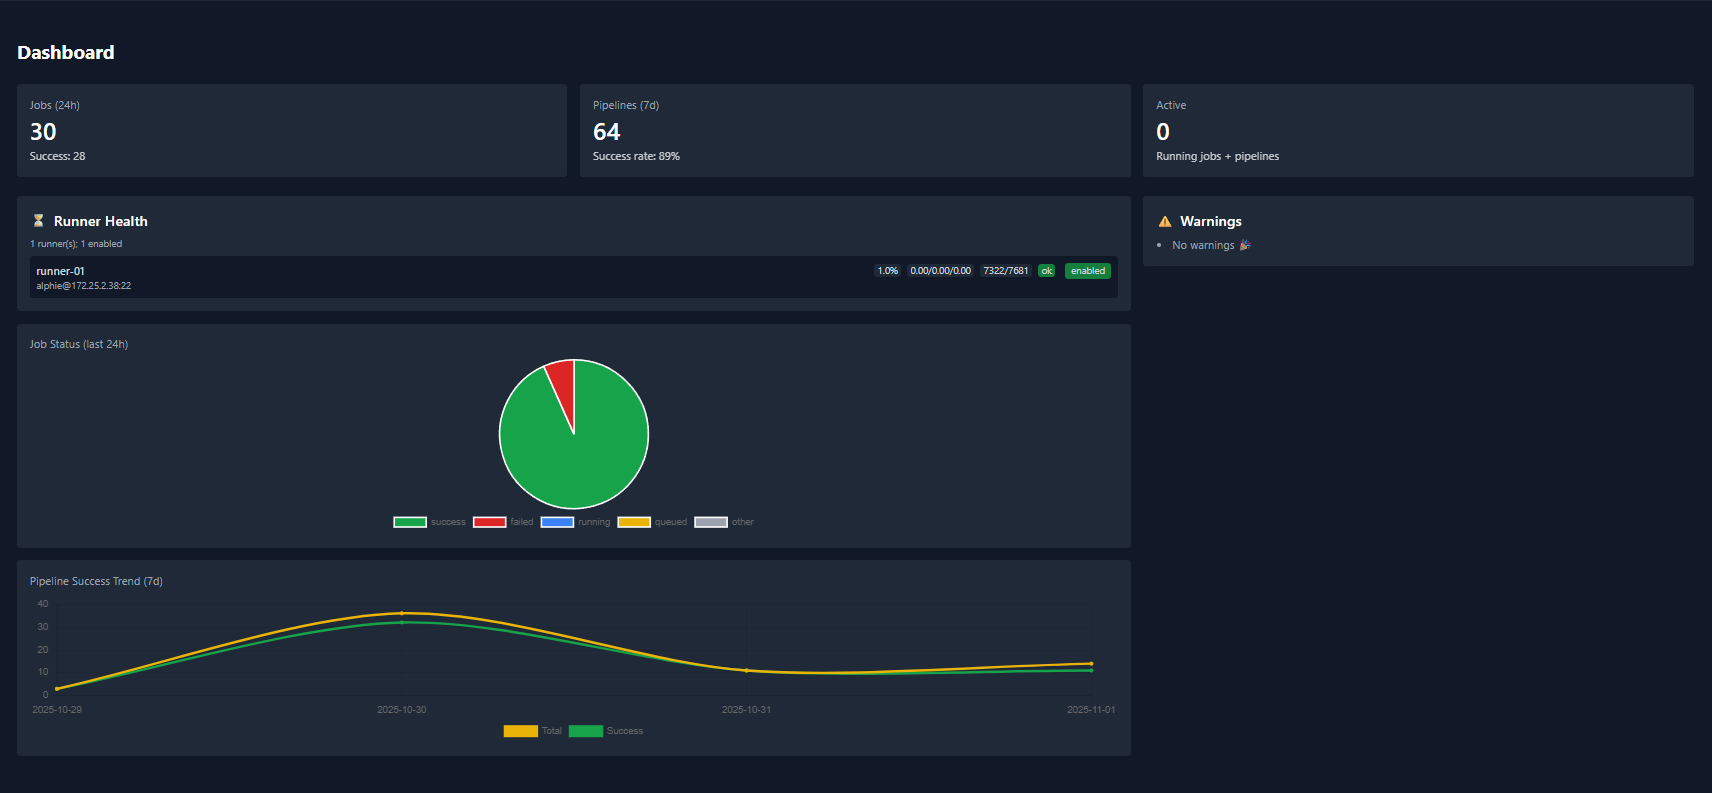
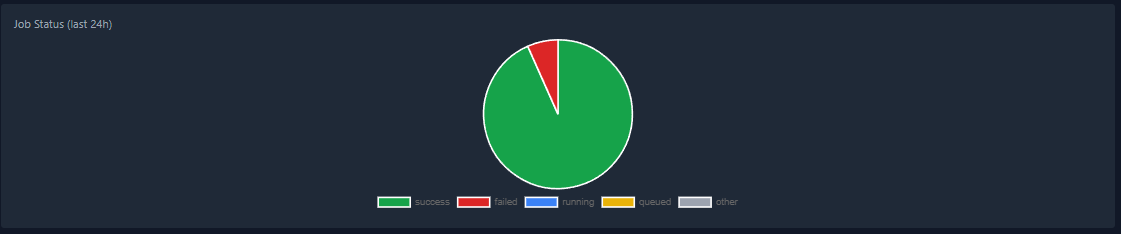
Job Status Chart.
This chart summarizes Runbook outcomes:
- Success
- Failed
- Running
- Queued
- Other
Data reflects activity from the last 24 hours.
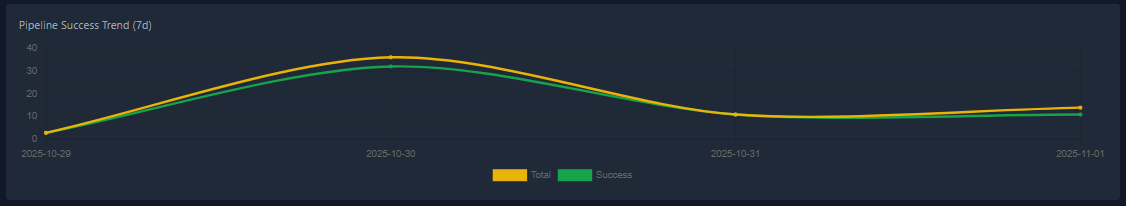
Pipeline Success Chart.
This chart summarizes Pipeline outcomes:
- Success
- Total
Data reflects activity from the last 7 days.